
Page 103 - AC/E Digital Culture Annual Report
P. 103
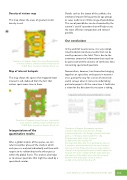
Density of visitors mapThis map shows the areas of greatest visitor density in red.Details such as the layout of the exhibits, the emotional impact felt by particular age groups or sexes leads to an in nite range of possibilities. This sea of possibilities can be channeled by the curator’s ‘useful’ questions that will help create the most e ective composition and content possible.Our conclusionsIn the world of neuroscience, it is very compli- cated to obtain conclusive results that can be used by novices in the eld. This is due to the enormous amount of information that needs to be processed and the absence of conclusive data concerning specialized questions.Neuroculture, however, has focused on bringing together art specialists and experts in neurosci- ence, paving the way for a series of extremely useful surveys when it comes to undertaking particular projects. At the same time it facilitates a vision for the direction the museum is taking.Translation of diagram: Subject-free zone. Greater density of visitors. Entrance. Exhibits. Collection A/B. Season A/B/C. Basic. Innovation. Stimulus. Check out.Map of interest hotspotsThis map shows the spaces that triggered most interest in red, deduced from the fact that visitors spent more time in them.Translation of diagram: Interest hot spot. Low interest point. Entrance. Exhibits. Collection A/B. Season A/B/C. Basic. Innovation. Stimulus. Check out.Interpretation of the quantitative resultsAfter a global analysis of the spaces, we can refer to another phase of the study in which each piece is analyzed individually and then with respect to its relationship to the other pieces within the global frame. The analysis also helps us to answer questions that might be asked by a specialized curator.Translation of diagram: Comparative emotional activation: laboratory versus museum. Average activation with guide: 1.67. Average activation with audio guide: 3.01. Average activation guide-free: 7.84. Activation with guide: Levels of interestare high at the start, but drop o .Very important. More data. From watching the videos, it is possible to detect that the visitor becomes distracted and looks at other things when there are larger numbers of people in the group and the visitor is further away from the guide. The main complaint with the audio guide was that very few of the exhibits were referred to properly. Activation with audio guide: Levels of interestare high at the start but then drop o .AC/E DIGITAL CULTURE ANNUAL REPORT 2017103
