
Page 71 - AC/E Digital Culture Annual Report
P. 71
Echo Nest project13analyses the songs based on criteria such as acoustics, tempo, rhythm, cadence, or “danceability.”
Anatomy of the user
What does Netflix track every time we connect to the service? Based on the information pro- vided by company employees in public presenta- tions, interviews, articles and posts on its Tech Blog, we can conclude that Netflix tracks very diverse and crosscutting information (Fernán- dez-Manzano; Neira; Clarés-Gavilán, 2016). For example, the type of content played back and rejected; the type of playback (if it was played back at normal speed, if the video was fast forwarded or rewound, paused or stopped, or abandoned); the amount of user playback (fre- quency and hours of streaming per session); user ratings of the content (thumbs up or down); the type of device accessing it; the browsing routes followed by the user and the searches conducted within the application; the date and time; the location of the content the user decides to playback or rejects, and technological aspects such as the type of connection, optimal buffer operation, etc.
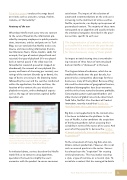
Image: Image (fictitious) of a Netflix dashboard showing the browsing routes followed by users, error rates and other key indicators, which are updated
in virtually real time. Source: Netflix Tech Blog.
As indicated above, services based on the Netflix model link us to contents using algorithms, operations that seek to simplify the user’s encounter with the product to ensure consumer
satisfaction. The impact of this selection of automated recommendations on the end user is increasing, to the detriment of active searches. Netflix, in particular, can display up to 40 rows of personalized content. The majority of these rows corresponds to an algorithm and usually includes the emotional categories described in the previ- ous section, specific to each user.
The fragmentation of audiences, which has so troubled the media over the past decade, has proven to be a competitive advantage for these businesses, many of them global.
Its impact on total viewing time is overwhelm- ing: two out of three hours of content played back on Netflix is “discovered” at this level.
The fragmentation of audiences, which has so troubled the media over the past decade, has proven to be a competitive advantage for these businesses, many of them global. Because of big data and the elimination of geographical barriers, traditional demographics have been overcome and the niches have started to become profitable. Consumption patterns go beyond borders and allow clusters of global tastes to be determined. Todd Yellin, Netflix’s Vice President of Product Innovation, recently stated that Netflix has identified more than 1,300 taste communities.14
Big data is not applied only to the content once it has been included on the platform. In the
case of Netflix, it also conditions the acquisition of third-party products (when assessing their suitability in terms of the tastes of its users). And even what they pay for it, because the number of people potentially interested in viewing it can be predicted.15
To the amazement of many, big data also con- ditions content production. However, this is not such an unusual practice in the sector. Success has always been the “inspiration” for creating similar phenomena. This may involve covering
a style, a type of narrative or a musical style. To assimilate a content that has managed to dazzle
AC/E DIGITAL CULTURE ANNUAL REPORT 2018
71
Digital Trends in Culture
